Understanding how your audience interacts with your Link in Bio pages is crucial for optimizing your online presence and tailoring your content to meet your audience's needs. Here's how to view this important data:
Step 1: Accessing Your Link in Bio Analytics
- Navigate to the BioPages Tab: Log into your LinkPod account and head over to the "BioPages" tab on the dashboard. This section houses all your Link in Bio pages.
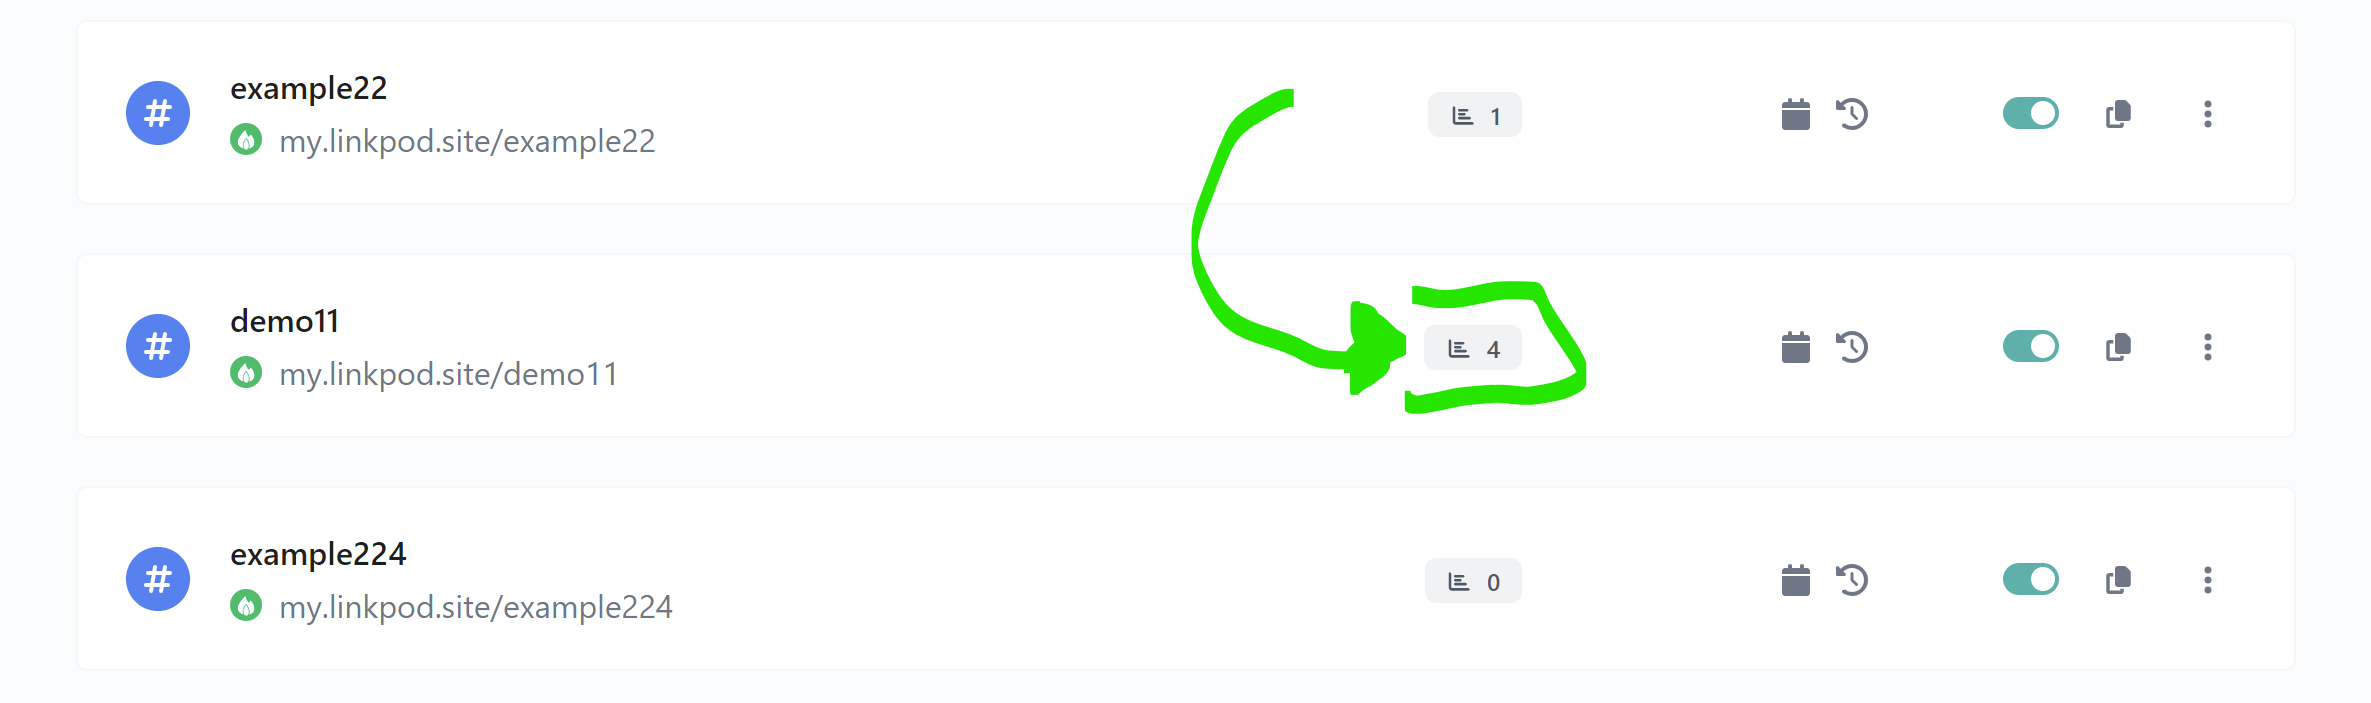
- Select Your Page: Browse through your list of Link in Bio pages and identify the one you wish to view analytics for.
- Click the Page Views Icon: Next to your chosen page, you'll find an icon resembling page views. Click this button to open the analytics view for that specific Link in Bio page.
Step 2: Understanding Your Analytics Dashboard
Upon accessing the analytics for your Link in Bio page, you'll be presented with various metrics and data visualizations. Here's a breakdown of what you'll see:
- Overview: A snapshot of key metrics such as page views, unique visitors, and engagement rate over a selected period.
- Entries: Detailed insights into specific visitor interactions, including time spent on the page and actions taken.
- Geographical Data: Information on where your visitors are coming from, broken down by countries and cities. This data helps in understanding your audience's geographical distribution.
- Referral Sources: Insights into how visitors are finding your Link in Bio page, whether through social media, search engines, or direct visits.
- Device and Browser Usage: Analytics on the types of devices (mobile, tablet, desktop) and browsers (Chrome, Safari, etc.) your visitors are using. This can inform how you optimize your content for different platforms.
- Language and UTM Parameters: Data on the primary languages of your visitors and any custom UTM parameters you've used for tracking specific campaigns.
Step 3: Adjusting the Date Range
To view analytics for different time frames:
- Select a Time Frame: Use the date range picker to choose the start and end dates for the data you wish to view.
- Apply Your Selection: Click on the "Apply" button to update the analytics dashboard according to your selected time frame.
Step 4: Resetting Your Statistics
Should you need to start fresh with your analytics, LinkPod offers the option to reset your statistics back to zero. This action is irreversible, so use it cautiously:
- Click the Reset Button: Find and click the "Reset" button on your analytics
dashboard. 2. Confirm Your Action: A prompt will ask you to confirm the reset. Confirm only if you are sure you want to erase all existing data and start anew.
Best Practices for Utilizing Analytics
- Regular Monitoring: Check your analytics regularly to stay informed about trends, audience behavior, and the effectiveness of your content strategies.
- Geographical Targeting: Use geographical data to tailor your content and marketing strategies to specific regions where your audience is most active.
- Optimize for Devices: Understanding which devices your audience uses allows you to optimize your Link in Bio page for better viewing and interaction on those devices.
- Analyze Referral Sources: Identify which platforms drive the most traffic to your Link in Bio page and focus your marketing efforts more on those channels.
- UTM Tracking: Make use of UTM parameters to track the performance of different marketing campaigns and understand which strategies are most effective.
Conclusion
LinkPod's detailed analytics for Link in Bio pages empower you to make data-driven decisions, enhancing your online presence and engagement strategies. By following this guide, you can access, understand, and utilize your analytics to improve your digital marketing efforts and better connect with your audience.